
90 SaaS Statistics and Insights for Unlocking Growth (2025)
Record, transcribe and summarize conversations with one click.
When the SaaS (Software-as-a-service) industry was officially launched by the introduction of Salesforce’s CRM in 1999, not many could have imagined that it would go on to sow the seeds of the multi-billion dollar institution that the SaaS market has become today.
SaaS products’ unparalleled ability to help businesses unlock immense levels of growth by simplifying and accelerating complex work at a small fee has resulted in a rapid increase in its adoption over the years.
We have curated 90 mind-blowing SaaS statistics and insights to give you a look into the evolution of SaaS solutions, how businesses are leveraging it to drive growth, and what the future holds.
Top SaaS statistics
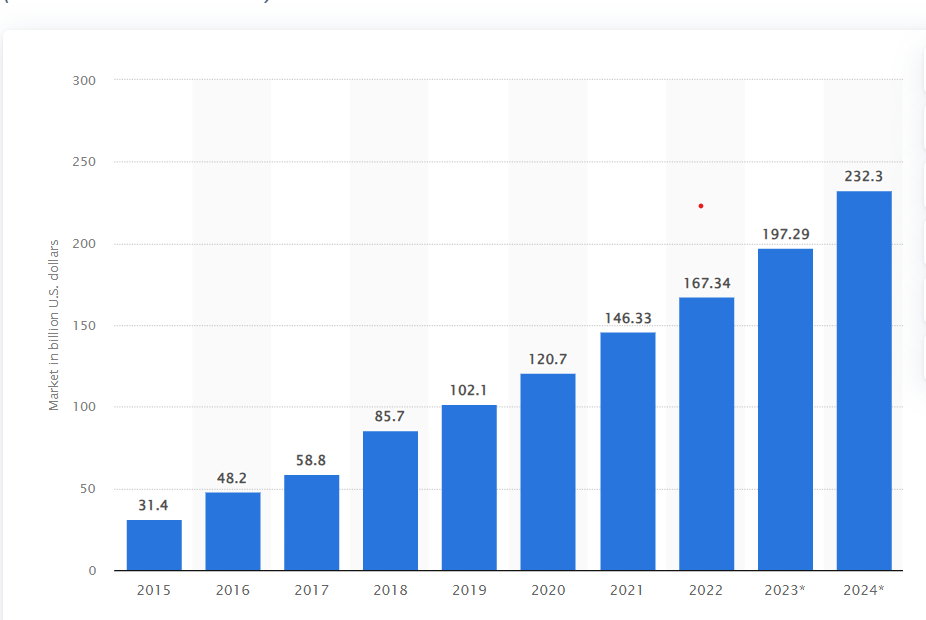
The SaaS industry is estimated to be worth approximately $197 billion in 2023. (Statista)
There are 30,000 SaaS companies in operation in 2023. (Ascendix)
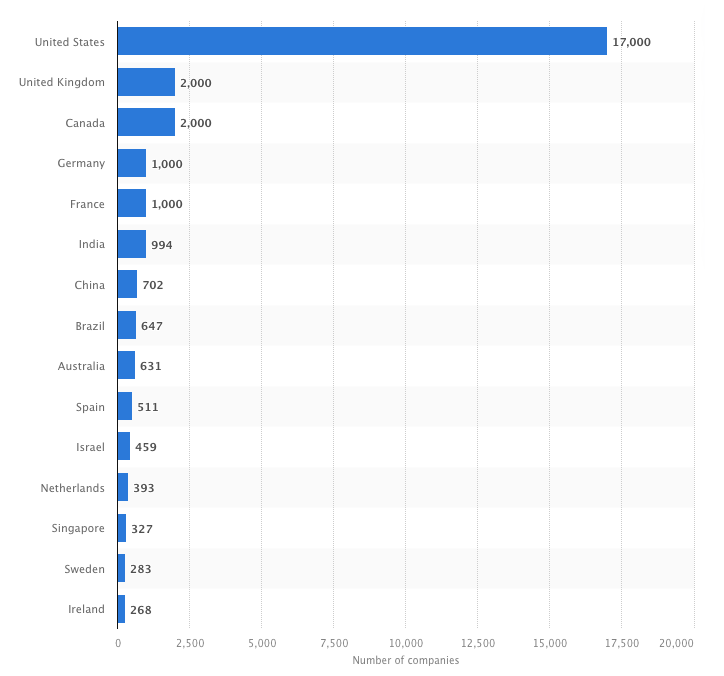
The United States has the largest SaaS market share worldwide, with around 17,000 SaaS companies. (Fortune Business Insights)
The average organization uses 110 SaaS applications. (Better Cloud)
Nearly 78% of small businesses have invested in SaaS solutions. (Tech UK)
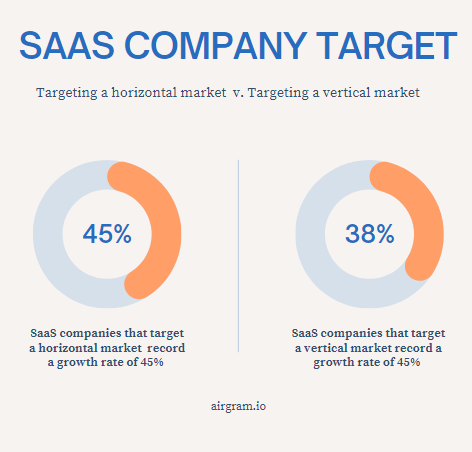
Horizontal SaaS companies grow faster than their vertical counterparts: 45% growth versus 38%. (SaaS Capital)
SaaS market growth statistics
The SaaS industry was initially introduced to enable small businesses who could not afford enterprise software suites to access the support they needed for their business activities at a reasonable price and scale.
However, factors such as its increased scalability over the years, cost-efficiency, accelerated digital transformation due to COVID-19, and overall improvements to its functionality have led to its widespread use - even among enterprise-level businesses. This has resulted in significant growth in the industry.
1. In 2022, the global SaaS market was valued at $237.48 billion and is forecasted to grow from $273.55 billion in 2023 to $908.21 billion by 2030 - a cumulative annual growth rate (CAGR) of 18.7% during the forecast period. (Fortune Business Insights)
2. Global SaaS end-user spending is estimated to be $197 billion in 2023 and will rise to an estimated $232 billion in 2024. (Statista)
3. The number of SaaS companies in the world grew from 25,000 in 2021 to 30,000 in 2023, a 20% increase. This figure continues to rise. (Ascendix)
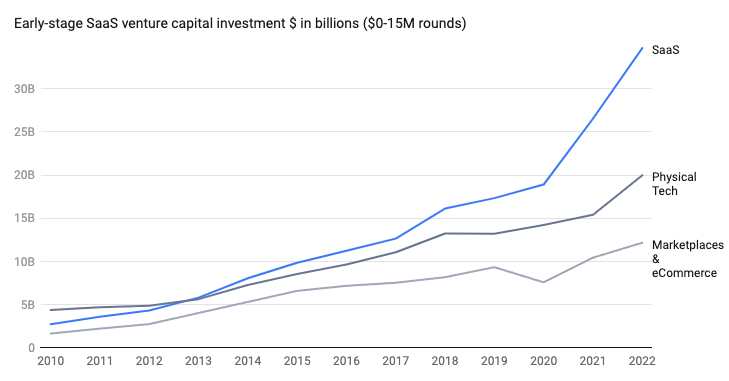
4. SaaS has become the most popular venture capital investment category with 45.1% of all venture capital investments in 2022 being on startups with a SaaS business model. In 2023, the percentage increased to 47.6%.
5. Early-stage SaaS companies received over half of the total VC investment in 2022, reaching over $30 billion. (Dealroom)
6. The median revenue growth rate of public SaaS companies in the United States with revenues of more than $100 million is 22%. (McKinsey)
7. Only 1.6% of SaaS companies managed to sustain significant revenue growth of 30% or higher between 2011 to 2021. (McKinsey)
8. The B2B SaaS industry is experiencing an unprecedented increase in the number of unicorns (private companies with a valuation of over $1 billion). Over 100 companies worldwide have achieved this status. (CB Insights)
9. The percentage of SaaS-powered workplaces is expected to jump from 45% in 2021 to 79% in 2024. (Statista)
10. The global market for web or video conferencing SaaS was valued at $3.5 billion in 2020 amid the COVID-19 pandemic. This figure is expected to double and rise to $7 billion by 2026 and $10.9 billion in 2030. (Report Linker)
11. B2C companies grow faster than B2B companies. (Chart Mogul)
Notta offers the most integrated AI meeting notes, summaries, and action items so nothing gets missed.
SaaS usage statistics
Regardless of the industry, business goal, and company size, there is always an abundance of easy-to-use and affordable SaaS options to choose from.
Companies are also increasingly recognizing the role of SaaS solutions in increasing productivity and securing a competitive edge. It’s no surprise that SaaS solutions have now become more popular than on-premise solutions.
12. The average organization uses 110 SaaS applications. (Better Cloud)
13. 99% of companies will be using at least one SaaS solution by the end of 2023. (BMC)
14. 78% of small businesses have invested in SaaS solutions. (Tech UK)
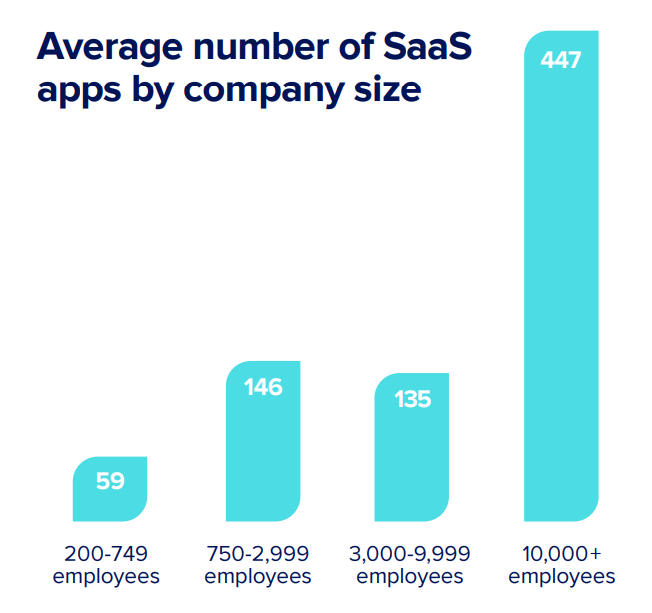
15. The number of SaaS applications adopted by companies varies according to their number of employees. (Better Cloud)
16. 45% of small and medium-sized businesses have all or most of their business applications based in the cloud. (AppDirect)
17. SaaS accounts for 70% of the average company’s software use and the figure is predicted to rise to 85% by 2025. (Exploding Topics)
18. SaaS companies lose 13% of their customers annually due to poor onboarding experiences. (Market Splash)
19. 84% of small and medium-sized businesses experience some difficulty when using new SaaS solutions. (AppDirect)
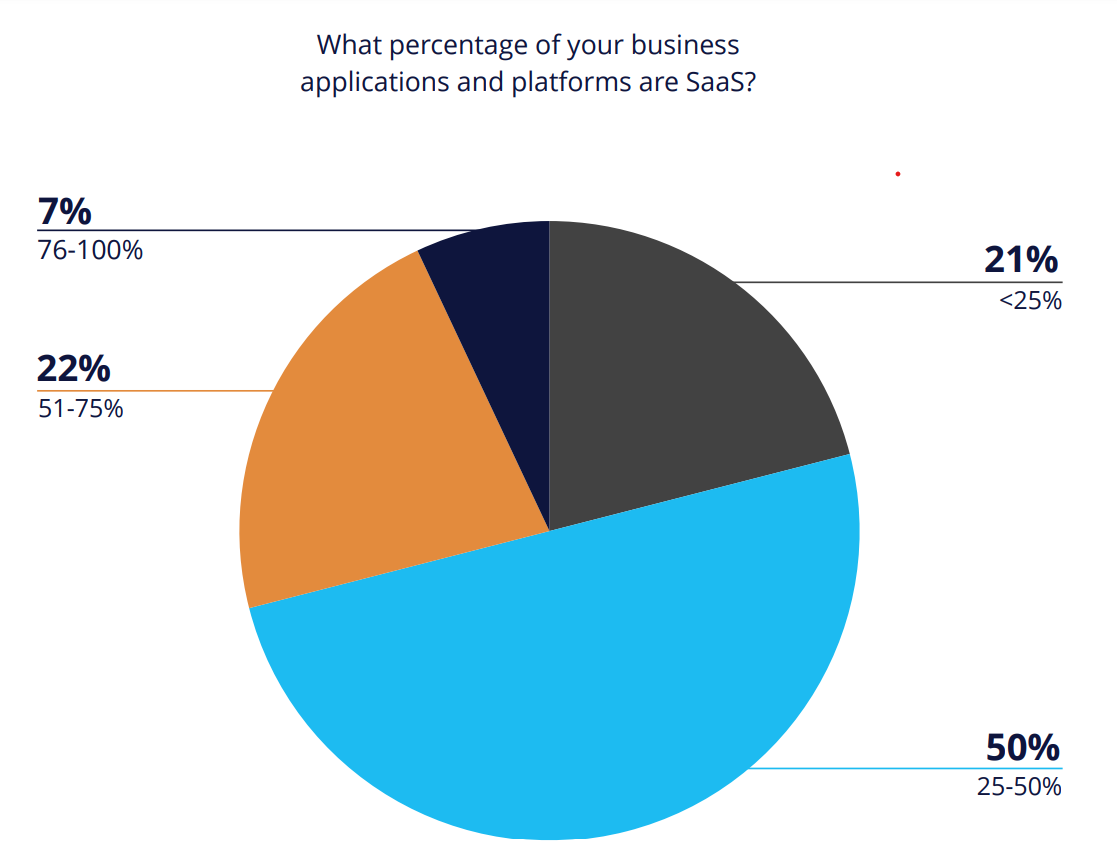
20. 79% of tech leaders say more than 25% of their business applications and platforms are SaaS. (Productiv)
21. Organizations have different levels of SaaS maturity:
SaaS-powered workplaces use an average of 212 SaaS apps and have 93% of their work software in the cloud.
Transitioning workplaces use an average of 79 SaaS apps and have 55% of their work software in the cloud.
Traditional workplaces use an average of 39 software and have 8% of their work software in the cloud. (BetterCloud)
22. A meager 36% of traditional organizations allocate an adequate budget to SaaS solutions and operations while 44% of transitioning companies do the same. In contrast, 59% of SaaS-powered companies direct enough of their funds to SaaS operations. (BetterCloud)
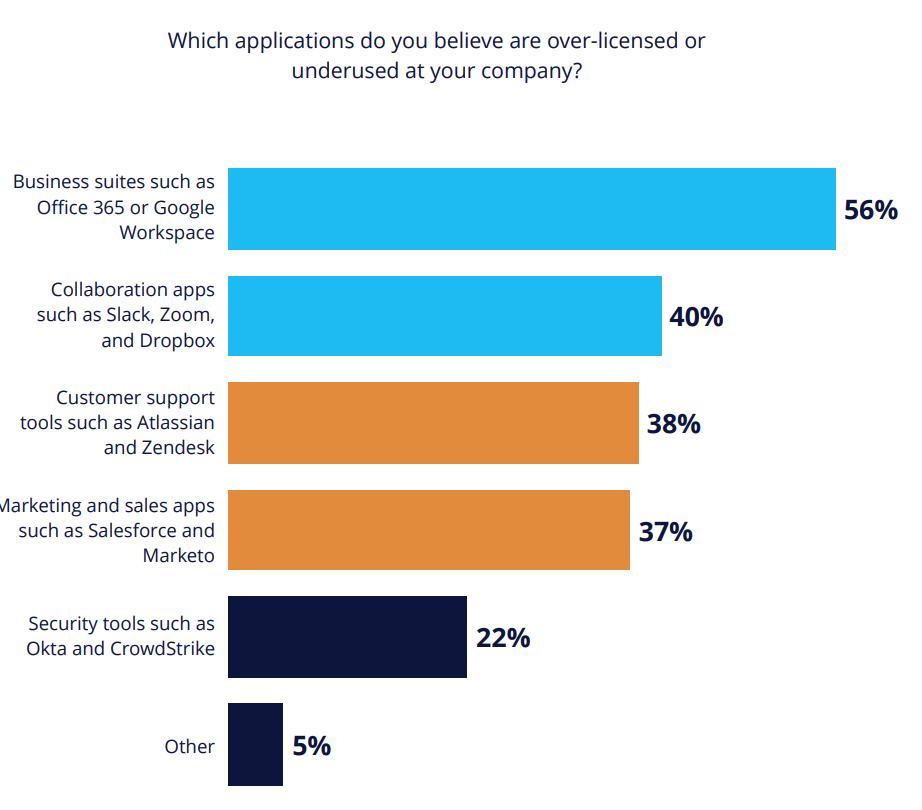
23. 56% of enterprise tech leaders believe business suites such as Google Workspace and Office 365 are underused and over-licensed. Collaboration apps are a close second with 40% of enterprise tech leaders expressing the same sentiments. (Productiv)
24. The use of SaaS solutions in the healthcare industry grows at a rate of 20% per year. (Forbes)
25. 70% of chief information officers claim that scalability and agility are top motivators for using SaaS apps. (Logic Monitor)
26. Moving to a SaaS-based system can reduce IT maintenance costs by 16.1%.
Regional SaaS statistics
Like SaaS adoption, the distribution of SaaS-producing companies is global and diverse. There are also clear, distinguishable patterns in the way SaaS solutions are produced and used across different regions in the world.
So, while SaaS production is concentrated in the USA, there are new emerging local SaaS markets carving their niche and establishing their presence in the industry.
27. The USA has 17,000 SaaS companies, which is over 8x more SaaS companies than any other country. (Statista)
28. The United Kingdom and Canada rank second with 2,000 companies each. (Statista)
29. The US has 59 billion SaaS customers, which is more than other nations combined.
30. India leads the Asian continent, with 994 SaaS companies and two billion customers.
31. China’s SaaS market size has grown steadily in the past decade. Its revenue was about RMB 50 billion in 2020. (China Briefing)
32. The Japanese SaaS market has been experiencing steady year-over-year growth since 2017 and is on track to exceed $1.5 billion in 2023. (Market Splash)
33. Africa and the Middle East are experiencing a surge in SaaS use, and are expected to achieve a 22.4% cumulative annual growth rate between 2021 and 2026.
34. North America is the region with the highest revenue share, holding about 55% of the global market in 2020.
35. Latin America is predicted to have a CAGR of 21.9% between 2020 and 2025.
36. The European SaaS market is estimated to reach $60.36 billion by 2025, with a CAGR of 18.4%.
37. The UK SaaS market was worth $7.5 billion in 2020 and was predicted to double in 2025. Chinese, Indian, and Brazilian SaaS markets have similar growth trends.
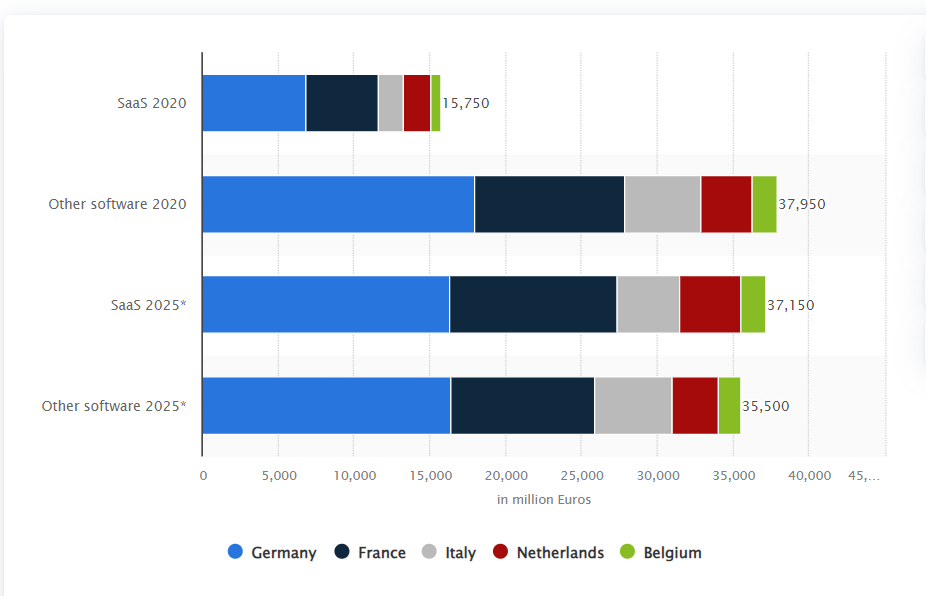
38. Germany is expected to hold the largest increase in SaaS market growth from major markets by 2025. Its market size is expected to grow from €6.85 billion in 2020 to €16.3 billion in 2025 - almost 3x in five years (Statista)
SaaS benchmarks stats
As someone working in the SaaS industry, monitoring benchmarks is a non-negotiable. Benchmarks provide valuable insight into the standards and fact-based metrics that you can measure your business performance against or set goals.
39. SaaS companies that target a horizontal market grow faster than companies that target the vertical industry with a growth rate of 45% versus 38%, respectively. (SaaS Capital)
40. The average cost to acquire a lead for a B2B SaaS company is $310 for paid leads while organic leads cost $164 per lead. (First Page Sage)
41. Growth in SaaS companies slows down as they mature. The top quartile of businesses in the $1 million to $8 million range grows 70% annually while the top quartile of businesses in the $8 million to $30 million grows around 45% annually. (Chart Mogul)
42. The median growth rate for B2B SaaS companies is 35%. (SaaS Capital)
43. The best-performing SaaS companies have a net revenue retention of 110%. (Chart Mogul)
44. Businesses with net retention over 100% typically combine high gross retention with a strong expansion loop. (Chart Mogul)
45. Sales teams are responsible for converting free accounts into paid ones in 23% of companies. Next is customer success at 15% of companies and the least is product ops at 3%. (Product Led)
46. When product qualifying leads (PQLs) are used to identify free accounts that are likely to convert to paid accounts, the conversion rate for free accounts triples. And only 25% of companies use PQLs in this way. (Product Led)
47. A paltry 2% of SaaS businesses with an ARPA of less than $25/month have net retention rates over 100%. (Chart Mogul)
48. 91% of companies intend to increase their product-led growth investment. (Product Led)
49. In B2B SaaS, on the other hand, 49% of SaaS businesses with an ARPA over $1k/month have a net retention of over 100%. (Chart Mogul)
50. Customer retention is typically lower when SaaS businesses are in their early stages but improves as businesses grow to achieve a better product-market fit. (Chart Mogul)
51. Best-performing customer retention rate at any business stage is approximately 80% and 90% for B2B SaaS companies. (Chart Mogul)
52. Freemium accounts have a 12% conversion rate at the median. This is a whopping 140% higher than free trial visitors' conversion rates. (Product Led)
53. The visitor-to-customer conversion rate in the B2B SaaS industry is 1.1%. (First Page Sage)
54. Churn is high in the early stages of a business. (Chart Mogul)
55. The higher a company’s ARPA, the lower its monthly net MRR churn rate. 47% of businesses with an ARPA over $1k have negative churn. (Chart Mogul)
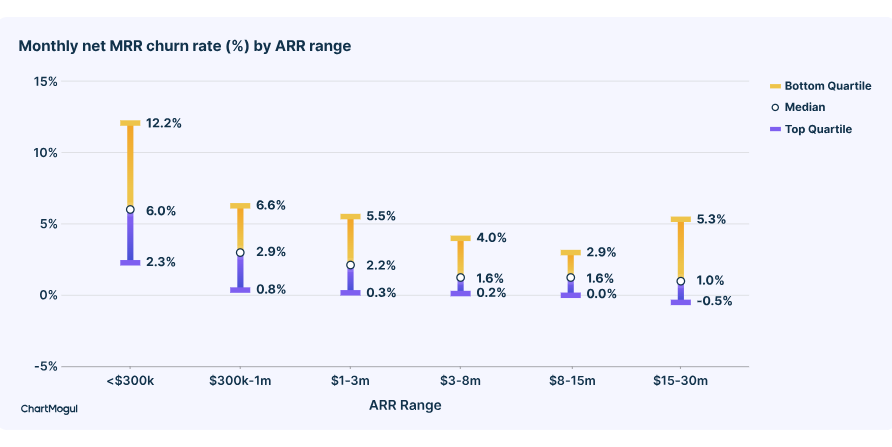
56. The top 25% of SaaS companies have a customer churn rate of 1-2% per month. (Chart Mogul)
57. It takes between 2 and 4 years on average for B2B SaaS companies to become profitable. (Kalungi)
SaaS pricing model statistics
SaaS offers products to customers over the cloud on a monthly or annual subscription basis or pay-as-you-go. On-premises software products, on the other hand, are paid for and set up in advance.
This practice is one of SaaS’ main appeals because it is flexible and businesses and individuals who use the service only pay when they need it.
SaaS companies can also benefit from the cyclical revenue of recurrent payments, instead of the one-off arrangement.
58. 46% of businesses use the “per user” pricing strategy. (Totango)
59. Usage-based pricing is gaining popularity, with 61% of SaaS companies using this model in some form in 2022. (Open View Partners)
60. 44% of SaaS providers offer a free trial. Of this group, 18% offer a 14-day free trial, and 41% offer a 30-day trial. (Totango)
61. 17% of SaaS providers use a freemium pricing model.
62. 41% of SaaS companies offer a pricing list on their website. (Totango)
63. SaaS companies are gradually discarding the discount mentality. 29% of companies do very little discounting and insist that “the price is the price” while another 39% only do occasional discounting for between 10-25% of deals. (Open View Partners)
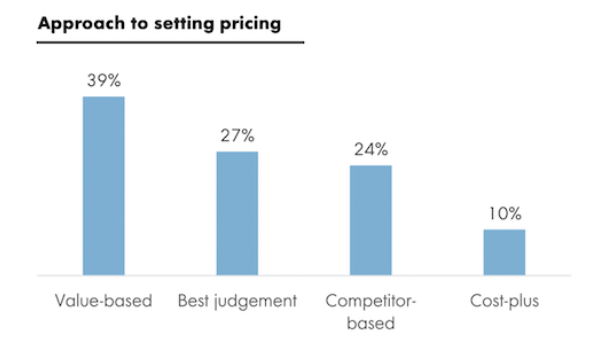
64. 39% of SaaS companies use a value-based approach when pricing while 24% base their pricing on competitors, and 10% base it on cost. (Open View Partners)
65. Most companies are underpriced in their early stages. The average deal size increases by about 50% when companies move into the expansion stage.
66. Only 6% of SaaS companies conduct proper pricing research based on their customers. 45% only do cursory market research while 48% do not do any pricing research at all.
67. 43% of SaaS companies review their pricing model more than once a year, 34% review theirs once a year, 15% do it once every 2-3 years, and only 8% never review their pricing. (Open View Partners)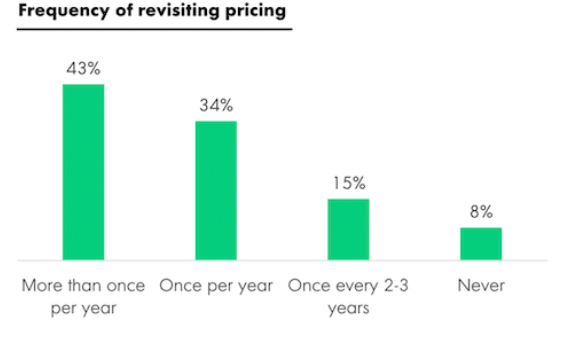
68. 20% of SaaS companies in their growth stage ($20-100 million) and 47% of later-stage companies ($100 million+) have a pricing manager or pricing team. (Open View Partners)
69. 75% of companies in their first stage of product-led growth choose a free trial or freemium model. (Product Led)
SaaS security and compliance
Despite the impressive advancements in SaaS solutions in recent years, it is far from perfect and security remains a major area of concern.
The following stats will shed light on the security issues that people care about.
70. 55% of security executives said they experienced a SaaS security incident in the last two years. This represents a 12% increase from 2021. (Cloud Security Alliance)
71. 58% of IT and security professionals report data leakage as the most common type of security incident they experience. This is closely followed by malicious apps (47%), data breaches (41%) and ransomware (40%).
72. SaaS file security violations spiked by 134% in 2021. (Better Cloud)
73. 45% of organizations experienced security policy violations.
74. The greatest data-loss risk, according to IT Professionals, comes from negligent employees. Negligent employees comprise 83% of the threat in SaaS-powered companies.
75. 43% of cloud identities remain unused or abandoned, leaving them exposed to security risks. (Varonis)
76. 1 in 4 identities in SaaS platforms are non-human. Examples are APIs, serverless applications, and virtual machines.
77. 15% of employees are transferring critical business data to their cloud accounts.
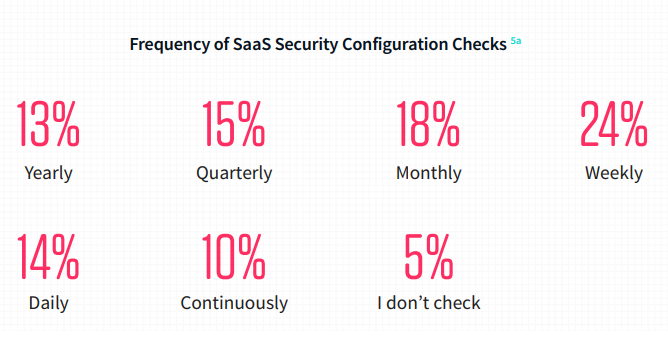
78. 1 in 20 organizations do not conduct SaaS security configuration checks and 46% only check monthly or less frequently. (Adaptive Shield)
79. 62% of organizations plan to or currently use SaaS Security Posture Management (SSPM) while 38% of organizations have no current plans to implement an SSPM.
80. 51% of organizations that use an SSPM reported their SaaS security improved and 33% report saving time with SaaS security management and maintenance (33%).
Statistics on emerging technologies in SaaS
Emerging technologies like AI and machine learning are influencing and revolutionizing the SaaS landscape.
81. Investment in AI SaaS startups reached $43.0 billion in 2022 (Techopedia).
82. 82% of cloud companies have AI-driven features in their SaaS products, while 18% do not. (BVP).
83. The AI SaaS Market size was valued at $73.8 billion in 2020 and is expected to reach $1.547 billion by 2030, at a CAGR of 37.66% from 2022 to 2030. (Verified Market Research)
84. Global AI software revenue will reach $118.6 billion by 2025, up from $9.5 billion in 2018. (Omdia)
85. 35% of SaaS businesses are already using AI, and another 42% intend to use it in the near future. (Tech Jury).
Saas predictions
Though the saying, “No one knows tomorrow” holds true, experts can give us a sneak peek into the future by making predictions based on history and current trends.
86. Low-code/no-code platform usage will triple by 2025. (Gartner)
87. Over 95% of new digital workloads will be deployed on cloud-native platforms by 2025. This represents a massive leap from 30% in 2021. (Gartner)
88. 72% of IT specialists believe that zero-touch SaaS automation is the future and 69% are already working toward it. (Spice Works)
89. Security will remain a major priority for SaaS users and vendors. Key topical areas will include zero-trust and secure coding. (O’Reilly)
Conclusion
The SaaS industry is not only thriving but also evolving at an unprecedented pace. The global SaaS market continues to grow, SaaS startups are attracting over 50% of VC investment, and 99% of companies will use a SaaS solution - all these indicate that the SaaS industry is teeming with opportunities for businesses that are willing to adapt, innovate, and stay abreast of trends and consumer needs.
The statistics in this article will help you get started. Now, you must be sure to leverage these insights to grow your business, and keep your eye out for updates!
References:
Mckinsy - SaaS and the Rule of 40: Keys to the critical value creation metric
Fortunatebusinessinsights - Software as a service SaaS market
Dealroom - SaaS guide
BetterCloud - The 2021 State of SaaSOps Report
Open View Partners - The State of Usage-Based Pricing
Productive - The State of Saas Management
Ascendixtech - How Many SaaS Companies Are There in the World
SaaS Capital - Growth Benchmarks for Private SaaS Companies
ChartMogual - SaaS Benchmarks Report
SaaS FAQs
What is SaaS?
SaaS is short for “software as a service”. It is a software delivery model where applications, which are typically designed to provide services that could otherwise be provided by humans, are hosted in the cloud are distributed to end users over the internet.
How do I choose the right SaaS solution?
Here’s to choose the right SaaS solution:
Define your business needs or the problems you need a product to address
Determine a clear budget or preferred product price range
Look at the free trial option and try out the products
Select a solution that is consistent with your goal and budget