
How to Create a Meeting Infographic (Step-by-Step)
Saving time and effort with Notta, starting from today!
A meeting infographic is a visual one-pager of your meeting's key decisions, action items, and discussion points. It's the format people actually read. Build one by hand with design tools like Canva — that takes 45–60 minutes. Or create one in under 2 minutes with Notta Brain, Notta's AI Meeting Execution Engine. This guide covers both methods so you can pick the one that fits your workflow.
What Is a Meeting Infographic?
A meeting infographic is a visual summary of your meeting's most important outcomes in one scannable image. It uses icons, charts, color-coded sections, and short text to show decisions, action items, owners, and deadlines at a glance.
Think of it as the visual version of meeting minutes. Normal meeting notes are long, text-heavy, and often ignored. A meeting infographic turns that same content into a format that takes 30 seconds to scan instead of 10 minutes to read.
Common use cases include:
Stakeholder updates. Share a project meeting recap with leaders who weren't in the room.
Client recaps. Send a polished visual summary after a client session or sales call.
Team alignment. Share a one-pager after a kickoff so everyone knows who owns what.
Weekly standups. Replace the meeting notes in Slack that nobody reads with a visual snapshot.
Why Turn Your Meeting Into an Infographic?
You already take meeting notes. Why go further and turn them into an infographic?
Because nobody reads your notes.
Research shows 65% of people are visual learners. The human brain processes infographics 60,000 times faster than plain text. And in a workplace context, a visual meeting summary is 30x more likely to be read than a text document buried in a Slack thread.
Here's what changes when you share meeting infographics instead of raw notes:
Decisions stick. When a key decision sits in a color-coded box with the owner's name next to it, people remember it. When it's buried in paragraph 7 of a Google Doc, they don't.
Action items get done. A visual action item list with owners and deadlines creates accountability. A bullet point in a long transcript creates plausible deniability.
Absent colleagues catch up faster. A one-page infographic gives someone the full picture in 30 seconds. A 45-minute recording gives them an excuse to "watch it later" (they won't).
Clients feel professionalism. Sending a branded infographic after a client meeting signals that you take the relationship seriously. Sending raw notes signals the opposite.
What to Include in a Meeting Infographic
Before you start designing, know what goes in. A strong meeting infographic covers these elements:
| Element | What to Include | Example |
|---|---|---|
| Meeting title & date | Clear header with meeting name, date, and type | "Q2 Product Roadmap Review — April 15, 2026" |
| Attendees | Key participants — just decision-makers, not everyone | Product, Engineering, Design leads |
| Key decisions | The 2–4 most important decisions made | "Launch date moved to June 1" |
| Action items | Tasks with owners and deadlines | "Sarah: finalize pricing by April 22" |
| Discussion highlights | Key data points or insights worth remembering | "Customer churn dropped 12% after onboarding redesign" |
| Next steps | What happens after this meeting | "Follow-up review scheduled May 1" |
Keep it to one page. If you need more than one page, you're including too much. The goal is signal, not completeness.
How to Create a Meeting Infographic Manually
If you prefer full control over the design, here's how to build one from scratch using tools like Canva, Piktochart, or Visme.
1.Gather your meeting notes
Pull together your meeting minutes, transcript, or handwritten notes. Pick out the key decisions, action items, and data points you want to highlight. If your notes are messy, spend 5–10 minutes sorting them into the six elements from the table above.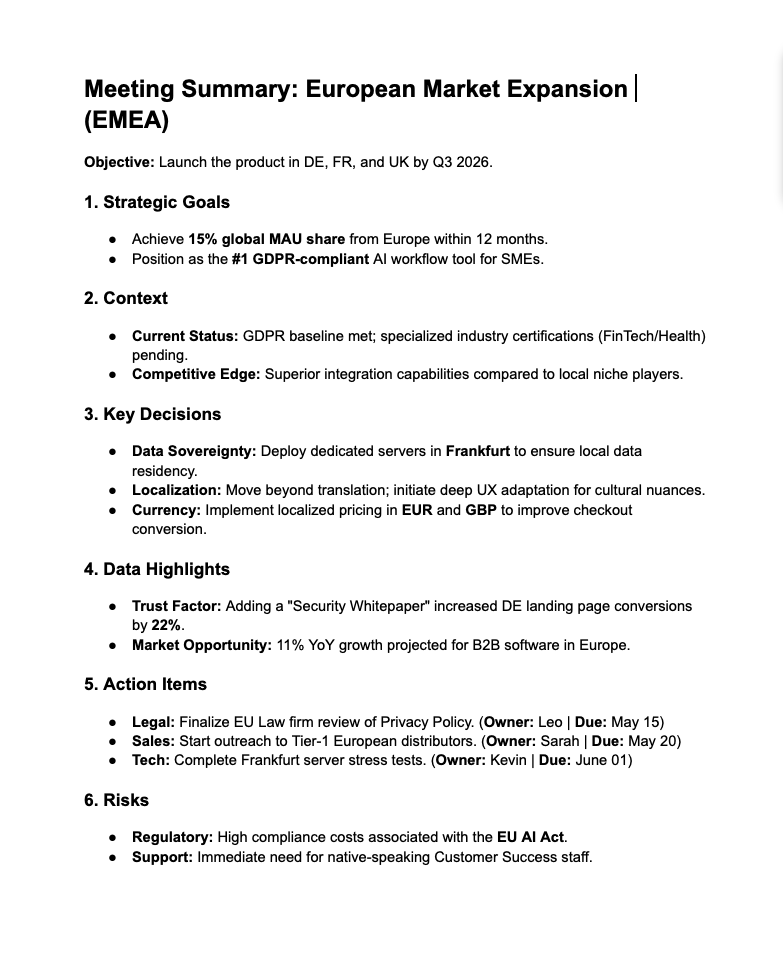
2.Choose a design tool
Pick a platform based on your skill level. Canva works well for beginners with its drag-and-drop interface. Piktochart and Visme offer more infographic-specific templates. All three have free tiers.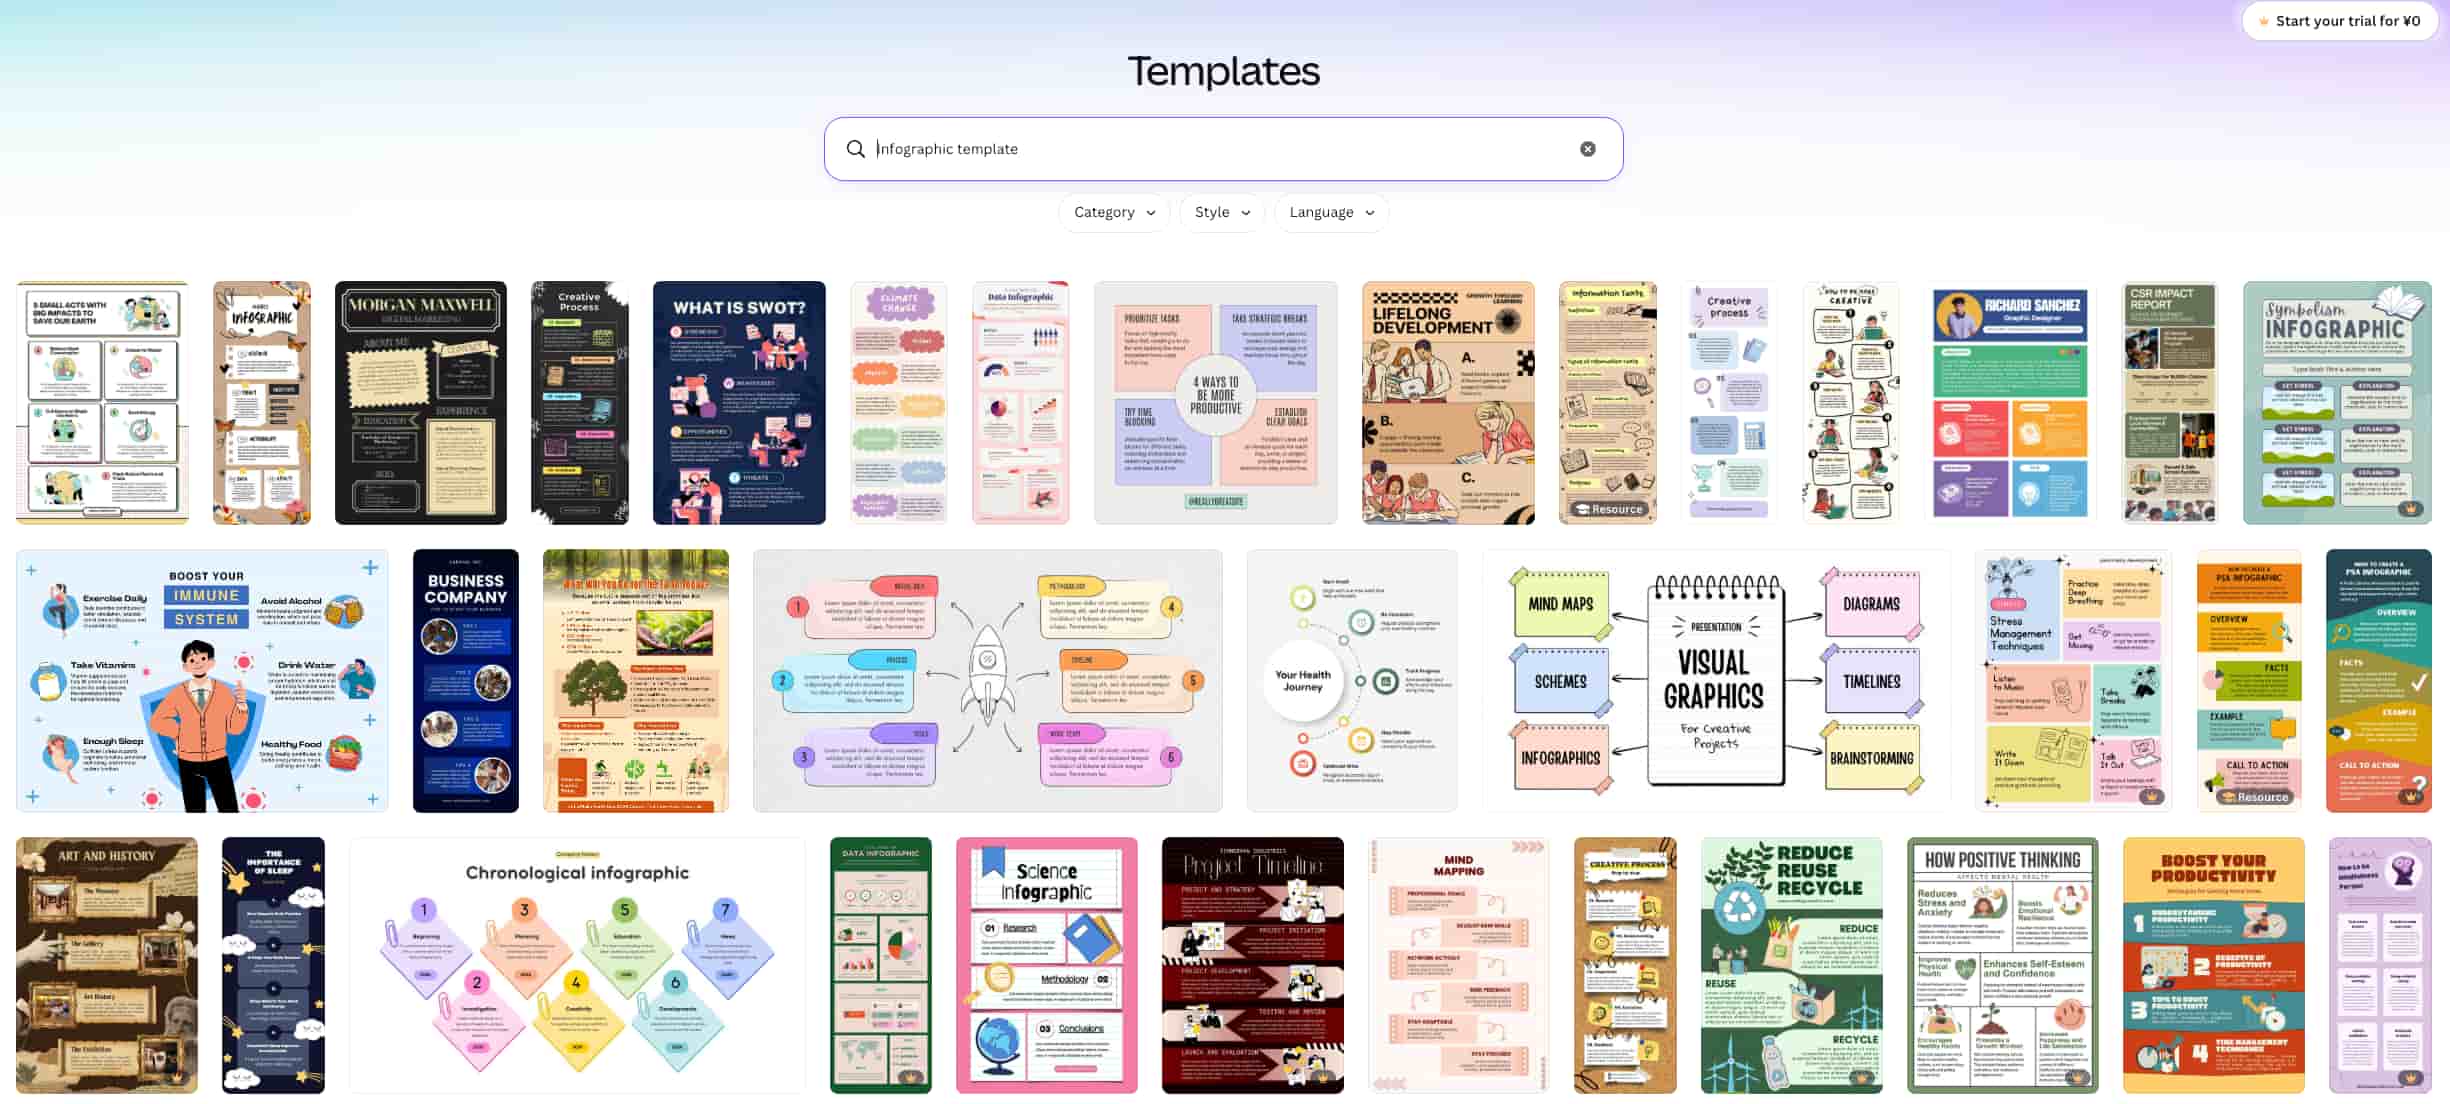
3. Select a template
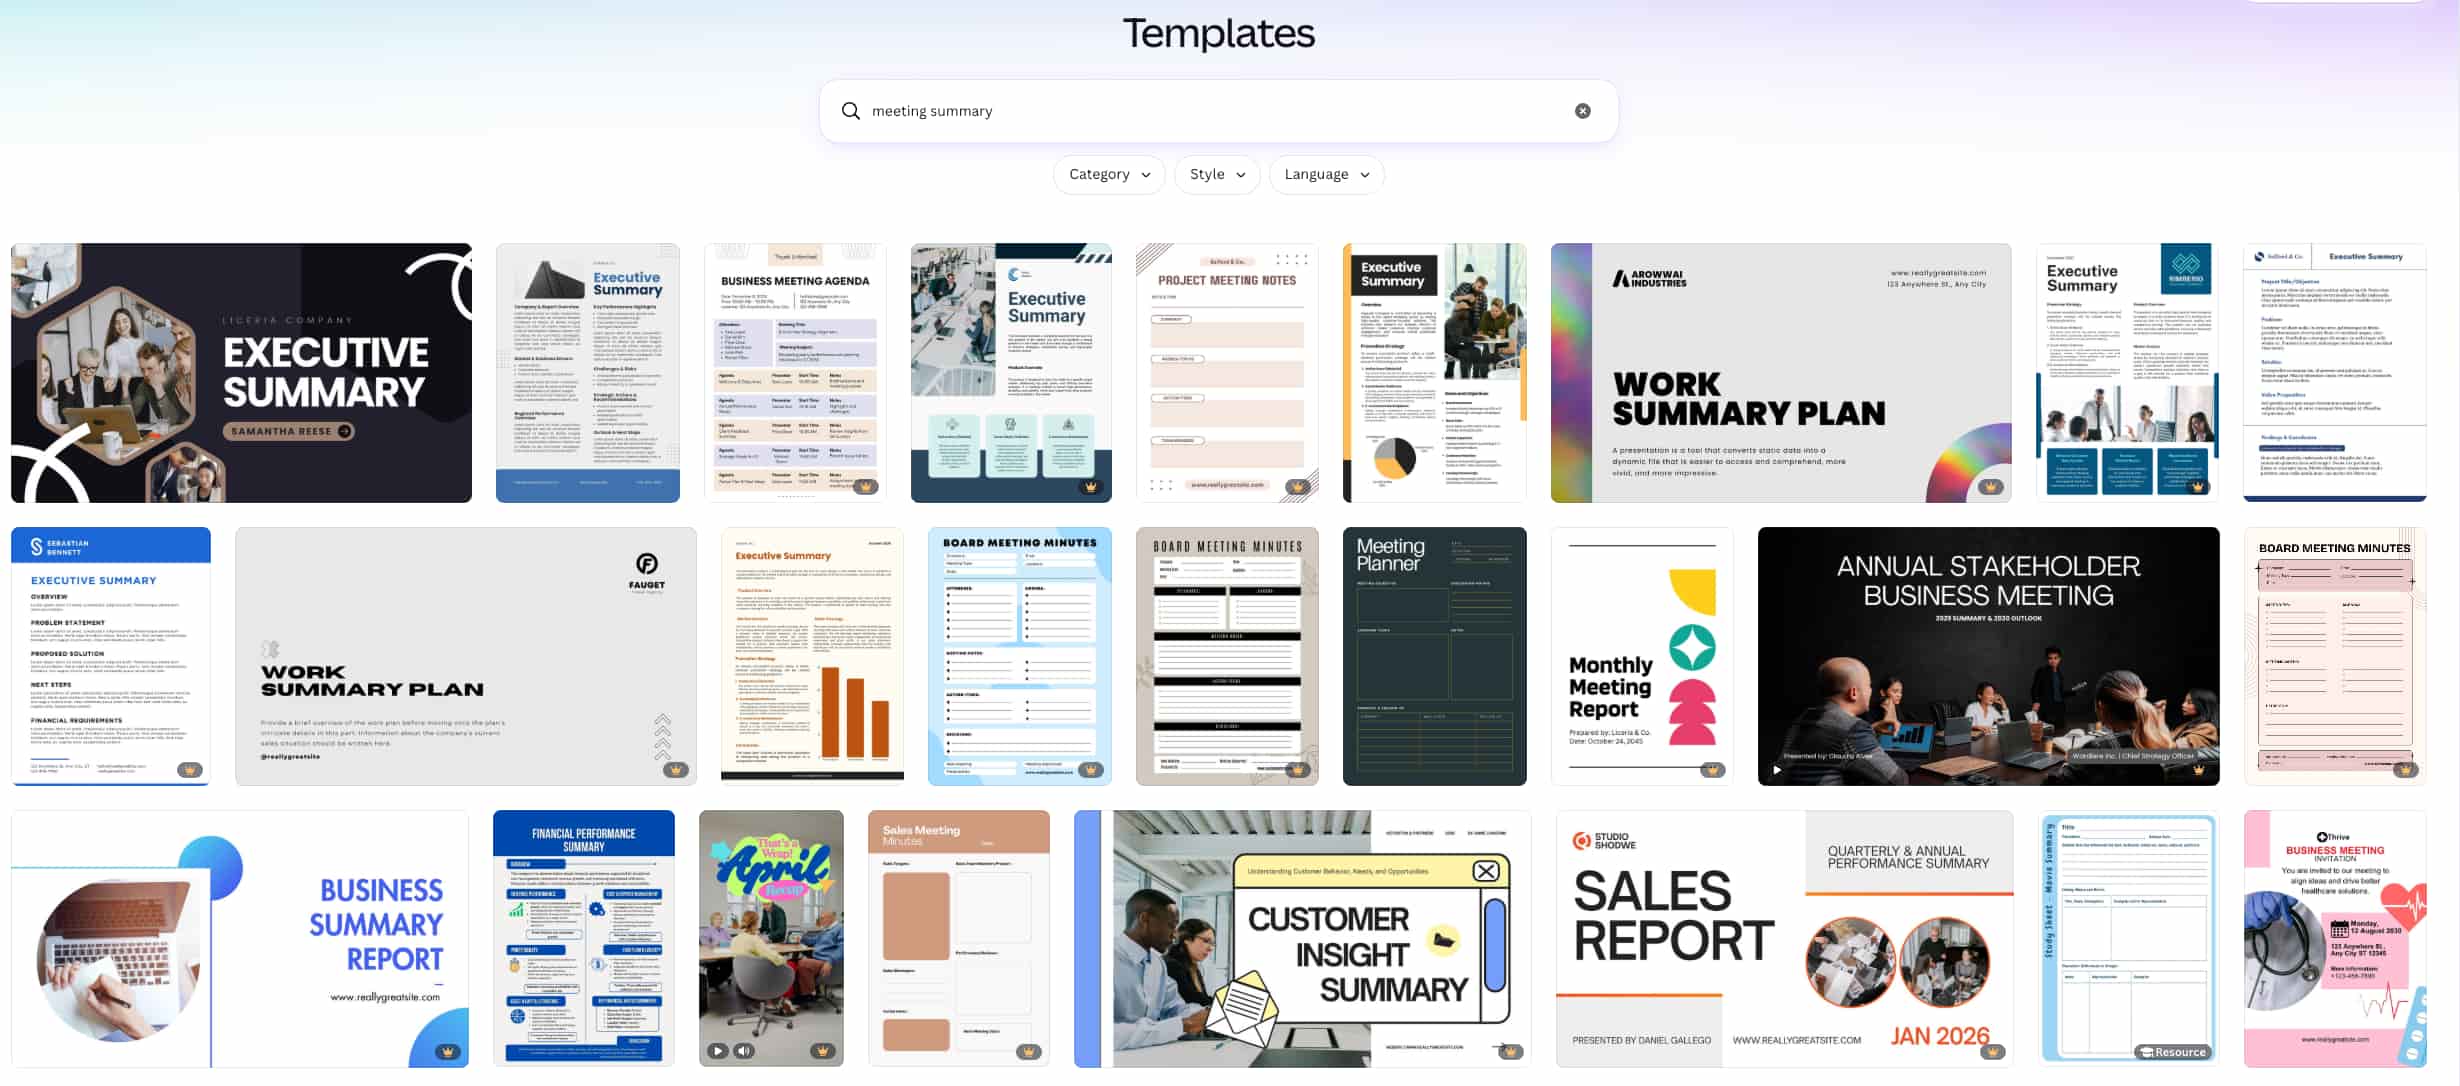
Search for "meeting summary," "meeting minutes," or "business infographic" templates. Look for layouts with sections for headers, bullet points, and icon blocks. Starting from a blank canvas is possible but adds 20–30 minutes.
4. Add your content
Replace the placeholder text with your actual meeting data. Follow this order from top to bottom: meeting title, attendees, key decisions, action items, discussion highlights, next steps. Use short phrases, not full sentences.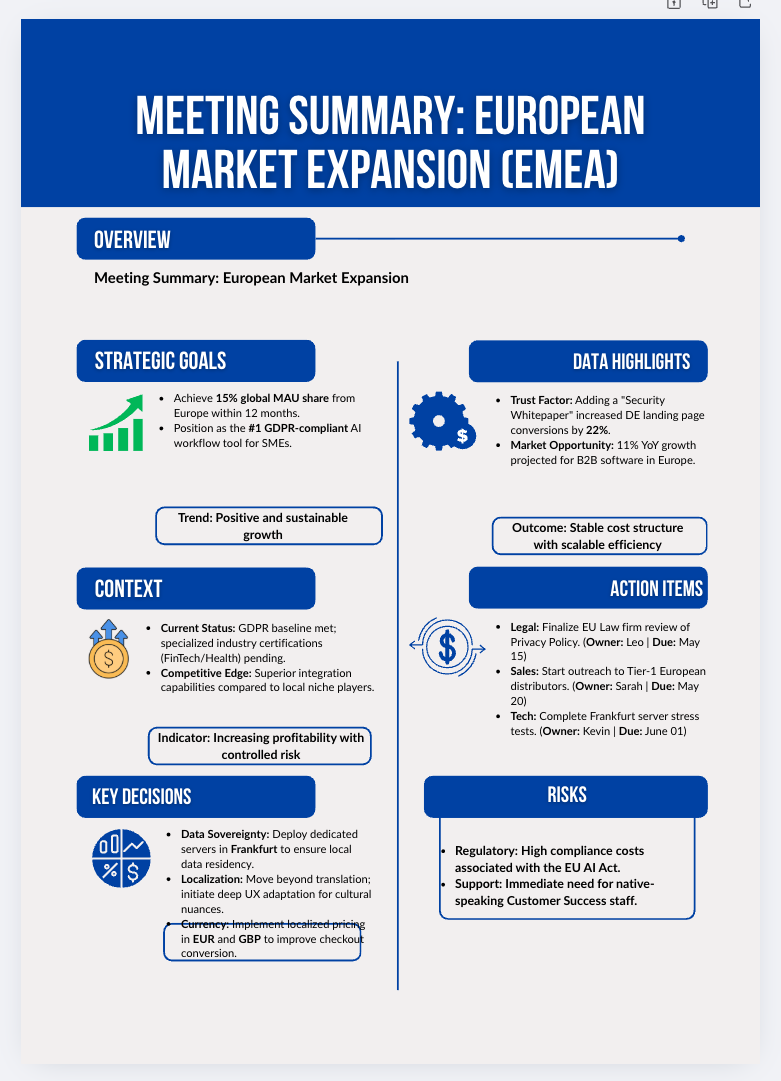
5. Apply visual hierarchy
Use color to separate sections. Make decisions and action items stand out with bold text or colored backgrounds. Use icons for categories — a checkmark for action items, a lightbulb for insights, a calendar for deadlines. Keep fonts to two maximum.
6. Review and export
Check for typos. Verify that action item owners and deadlines are correct. Make sure the infographic is readable at a glance. Export as PNG for Slack and email, or PDF for formal distribution.
Total time: 45–60 minutes (assuming you already have organized meeting notes).
The manual method gives you pixel-perfect control. But it has a clear bottleneck: you need to do it after every meeting. For teams running 5–10 meetings per week, that's 4–10 hours of design work that adds up fast.
How to Create a Meeting Infographic with AI
What if you could skip the design work entirely and go straight from a meeting recording to a finished infographic?
That's exactly what Notta Brain does. Notta Brain, Notta's AI Meeting Execution Engine, takes your meeting transcript and creates a clear infographic on its own. No design skills. No template hunting. No copy-pasting between tools.
Here's the step-by-step process:
1.Record and transcribe your meeting
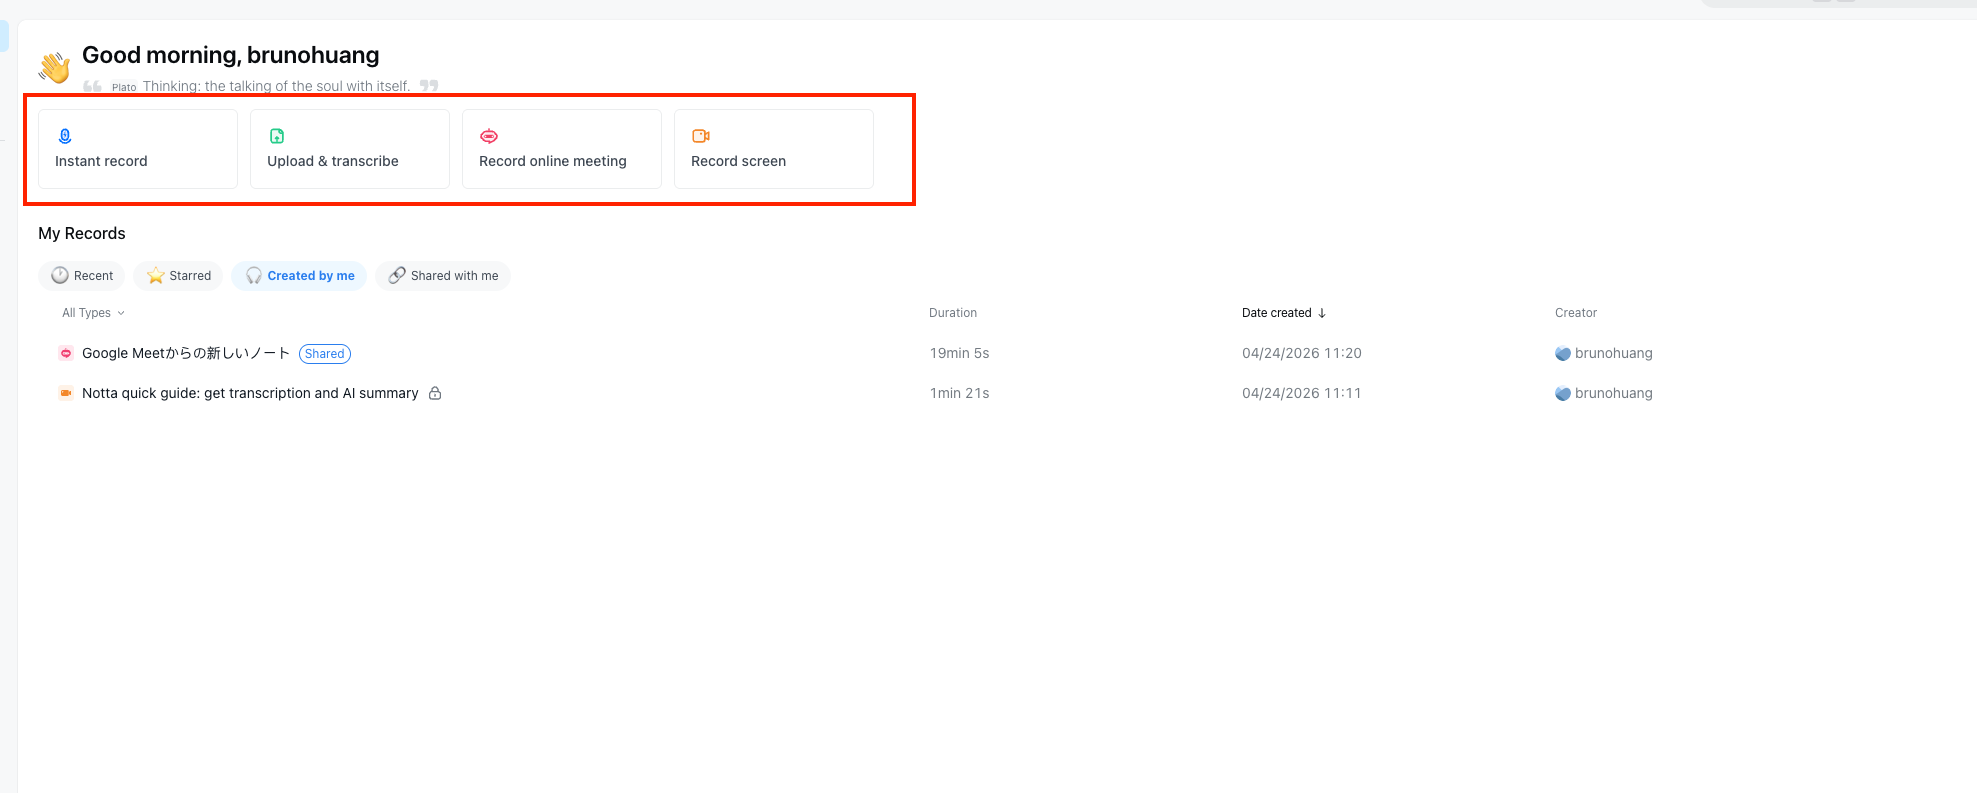
Notta, an AI-powered meeting productivity platform, captures your meeting in several ways. A bot auto-joins Zoom, Microsoft Teams, Google Meet, or Webex for real-time transcription. Notta Desktop, a Bot-Free meeting recording client, records locally with zero delay. You can also upload existing recordings. All methods produce a searchable transcript with speaker labels in 58+ languages.
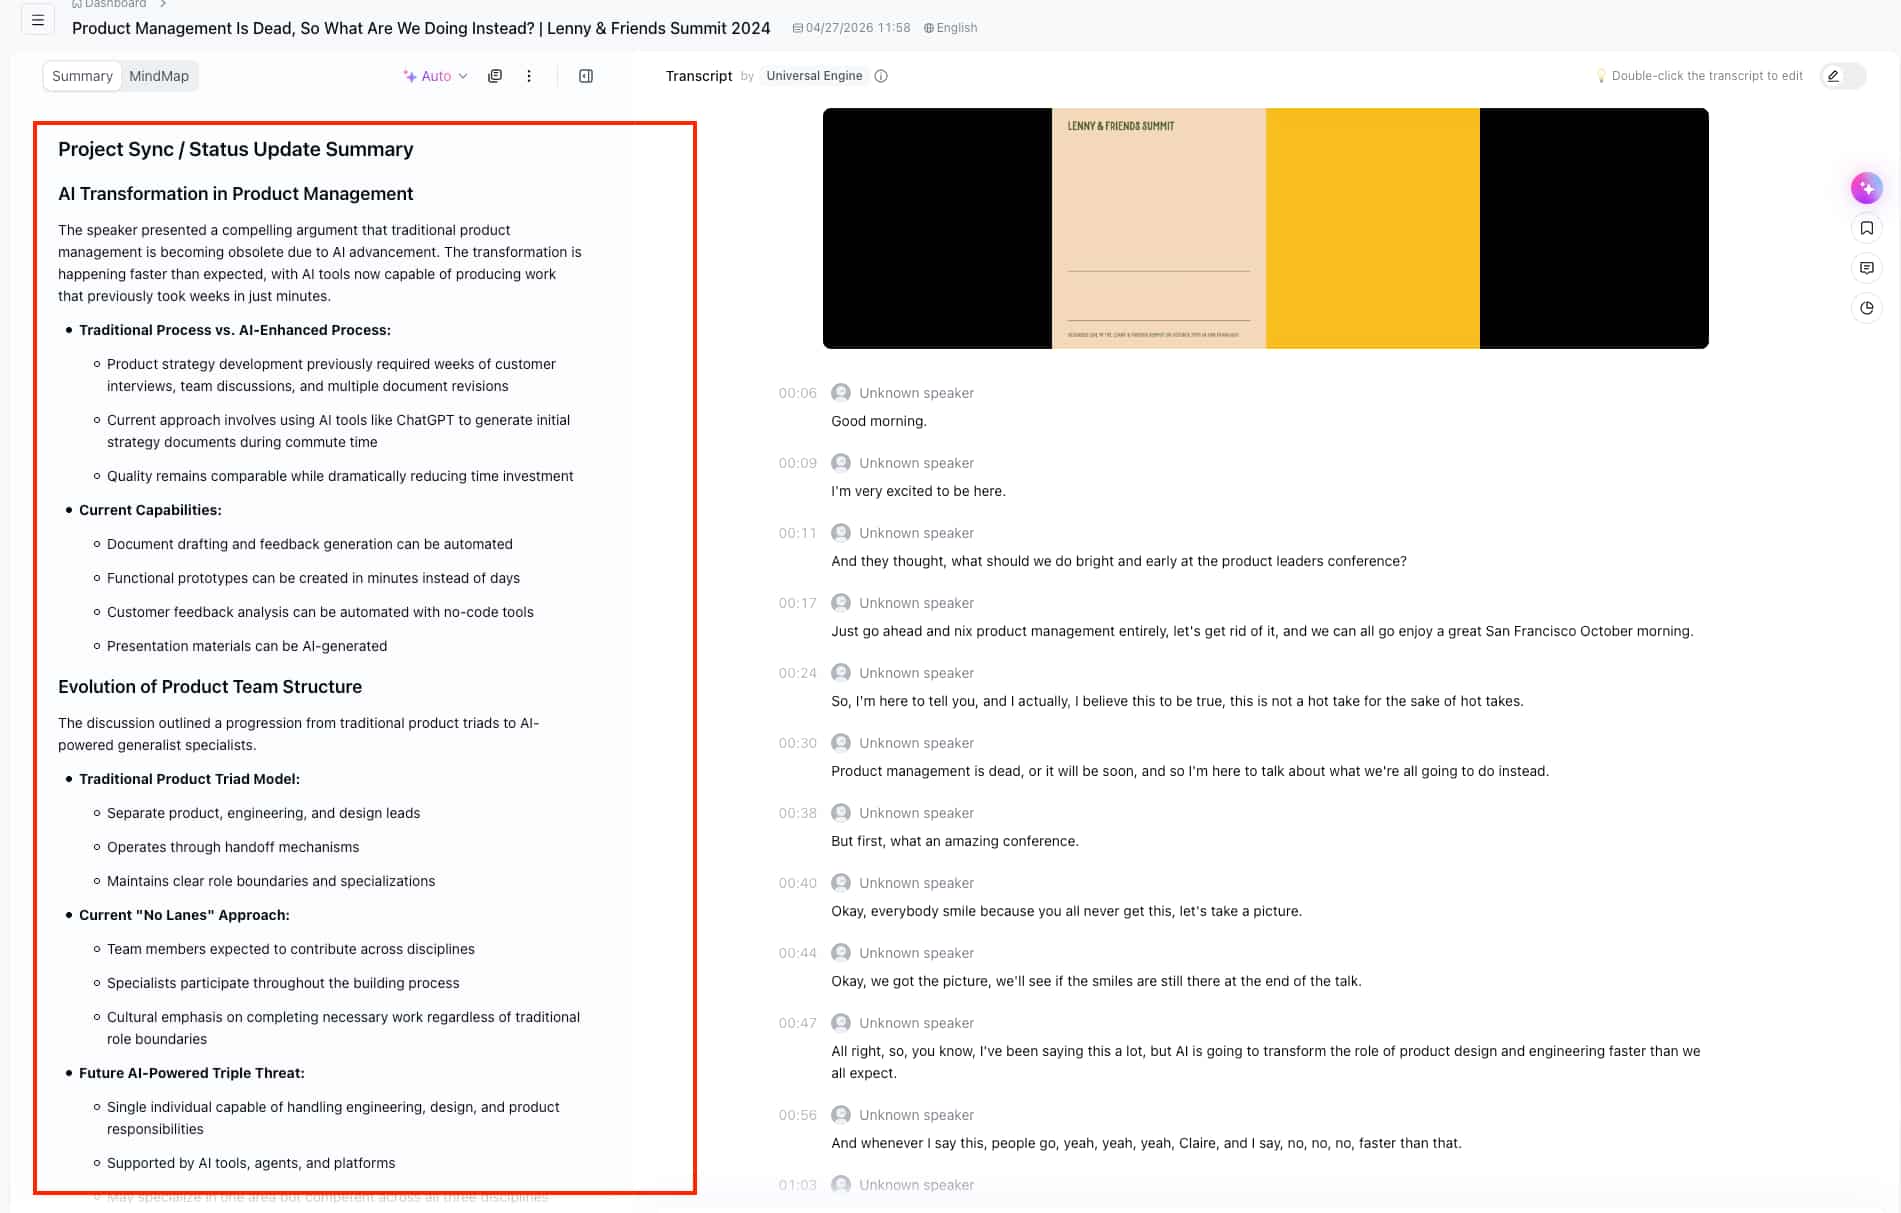
2.Get a meeting summary
Once the meeting ends, Notta creates an AI summary. It pulls out key decisions, action items with owners, key points, and next steps. You can also use custom AI templates to match your team's preferred format.
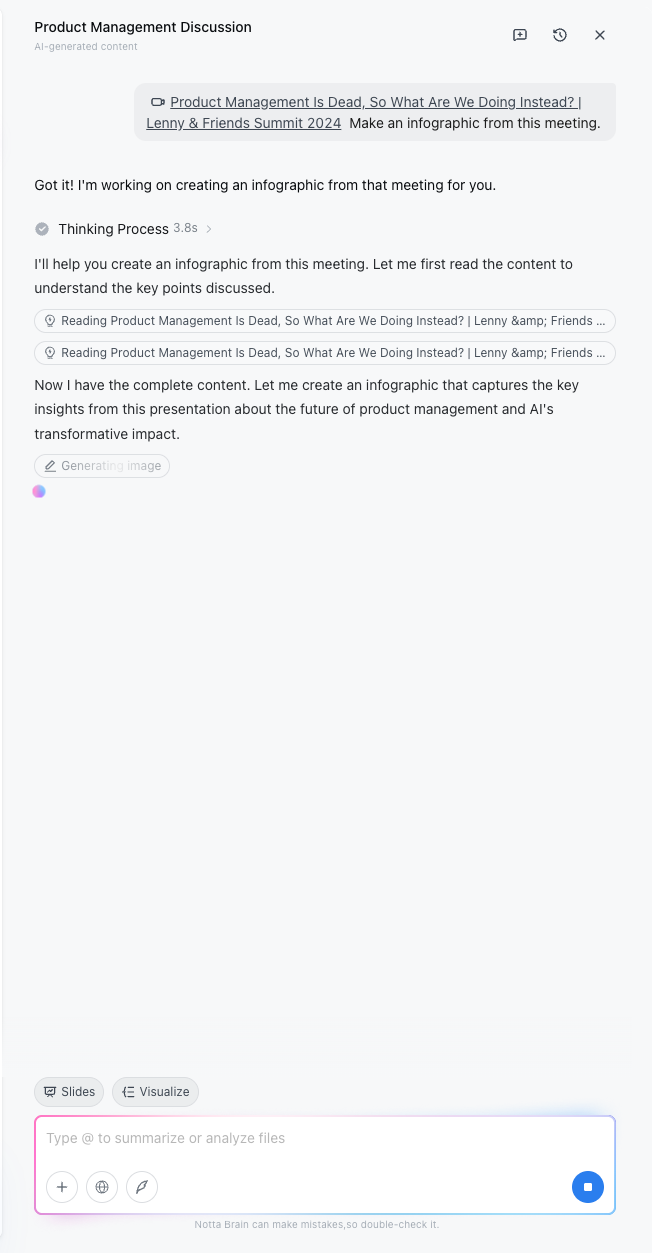
3.Create the infographic with Notta Brain
Open Notta Brain, Notta's AI Meeting Execution Engine, and ask it to create an infographic from your meeting. Brain reads the full transcript and summary, finds the most important details, and builds a clear visual infographic. You can also @ reference several meetings or uploaded files. Brain pulls them into one infographic that covers insights across sources.
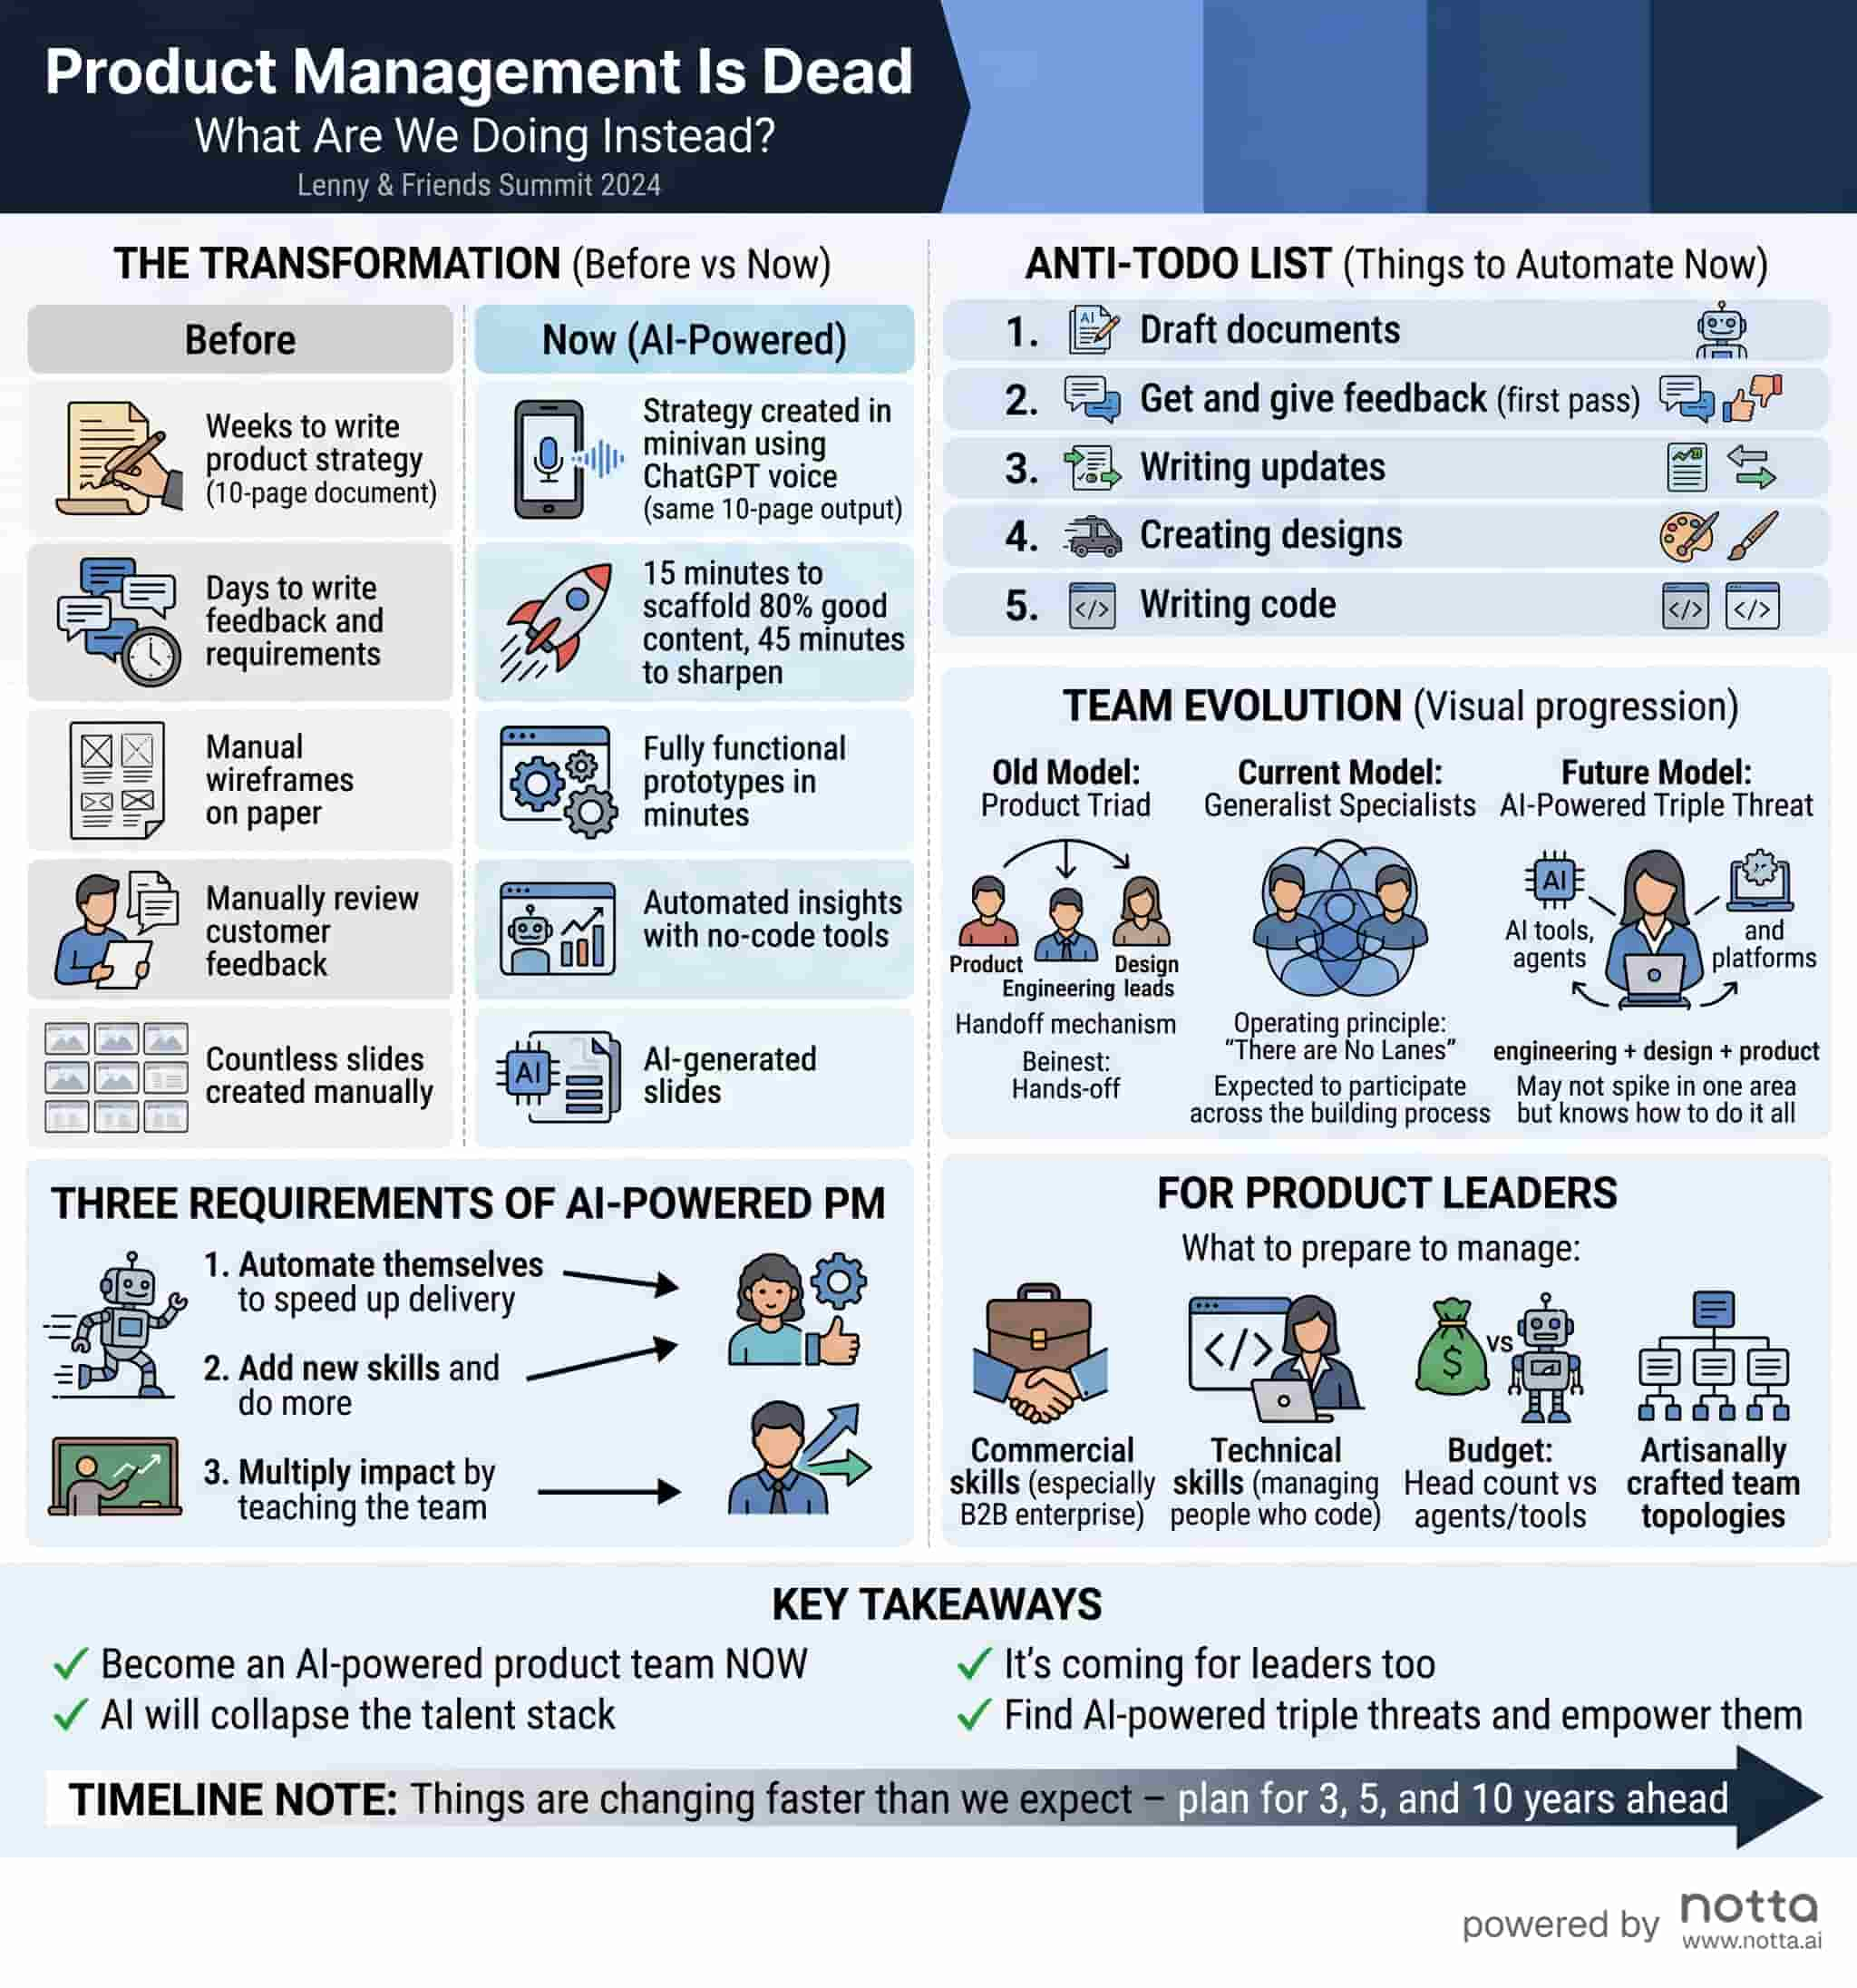
4.Export, and share
Every infographic Notta Brain creates is fully editable. Adjust the content, reorder sections, or shift the focus. Then export and share with your team or clients.
Total time: under 2 minutes from meeting end to finished infographic.
Notta doesn't just create infographics. It creates slides, reports, email drafts, action lists, Excel files, and more from the same meeting content. Every output is ready to use. Send it straight to a client or stakeholder. AI Credits start at 1,000/month free on the Free and Pro plans. An add-on is available at $93.59/year for 8,000 credits/month. Credits are only charged for successful outputs.
If you already have text notes, use the Notta Notes to Infographic tool. It serves as a direct pathway to convert text notes into professional visual assets in seconds. Simply paste your text into the tool, and it will instantly generate your infographic.
Your meeting data stays secure with SOC2 Type II, ISO 27001, GDPR, CCPA, and HIPAA compliance, plus AES-256 encryption. User data is never used for AI training.
AI vs. Manual: Which Method Should You Choose?
| Factor | Manual (Canva, Piktochart, Visme) | AI (Notta ) |
|---|---|---|
| Time per infographic | 45–60 minutes | Under 2 minutes |
| Design skills needed | Basic to intermediate | None |
| Template required | Yes | No — AI creates the layout |
| Consistency across meetings | Depends on the designer | Consistent structure every time |
| Multi-meeting synthesis | Very difficult by hand | Built-in — @ reference across meetings |
| Multilingual support | Manual translation needed | 58+ languages, bilingual transcription in 23 languages |
| Best for | One-off, highly branded infographics | Recurring meetings, fast turnaround, team-wide use |
| Cost | Free tiers available; Pro plans $10–25/mo | Notta Pro starts at $8.17/mo (annual); 1,000 AI Credits/mo included free |
For a one-time, heavily branded infographic where every pixel matters, the manual method works. For everything else — weekly team meetings, client recaps, project updates — the AI method wins. It saves you 40+ minutes per meeting and keeps the output consistent.
The real comparison isn't just time. It's what happens to the 43–58 minutes you save. That's almost an hour back per meeting you can spend on the work that actually came out of the meeting.
7 Tips for Better Meeting Infographics
Whether you use the manual or AI method, these tips will improve your results:
1.Lead with decisions, not discussion. Your audience wants to know what was decided and what happens next. Put decisions and action items in the top half. Background context goes at the bottom — or gets cut entirely.
2.One page, always. If your infographic spills onto a second page, you're including too much. Cut the least important section. A meeting infographic is a summary, not a transcript.
3.Name the owners. Every action item needs a person's name next to it. "Update the roadmap" is a wish. "Sarah: update the roadmap by April 22" is a commitment.
4.Use color to create sections, not decoration. Assign one color per section type — blue for decisions, green for action items, gray for context. This creates instant visual scanning. Avoid using more than 3–4 colors.
5.Include the date and meeting title. It sounds obvious. But many meeting infographics become useless a week later because nobody can tell which meeting they're from.
6.Design for the channel. Sharing on Slack? Optimize for mobile viewing with a vertical layout and large text. Emailing a client? Use a more formal layout with your company branding.
7.Create a template once, reuse forever. If you're using the manual method, build one strong template and duplicate it for every meeting. If you're using Notta Brain, the AI handles this with consistent structure across all your meetings.
Frequently Asked Questions
Can I create a meeting infographic for free?
Yes. Design tools like Canva, Piktochart, and Visme offer free tiers with templates. Notta's Free plan includes 1,000 AI Credits per month for Notta Brain, which can create infographics from your meeting transcripts. Notta also offers a 7-day free Business trial for teams.
How do I turn a meeting transcript into an infographic?
Two options. By hand: pull out key decisions and action items from the transcript, then design the infographic in Canva. That takes 45–60 minutes. With AI: use Notta Brain, Notta's AI Meeting Execution Engine, to create a clear infographic from your transcript in under 2 minutes.
What's the best tool for creating meeting infographics?
For manual design, Canva is the easiest option. For AI-powered creation from meeting recordings, Notta stands alone. It combines real-time transcription, AI meeting summaries, and infographic creation in one workflow. Notta Brain produces ready-to-share infographics, slides, reports, and more from your meeting content.
How long does it take to create a meeting infographic?
By hand with a design tool: 45–60 minutes per infographic, assuming you already have organized notes. With Notta Brain: under 2 minutes from meeting end to finished infographic. For teams with several meetings per week, the AI method saves 3–5 hours weekly.

